How much progress is being made in your local area in relation to tackling poor health outcomes and health inequalities?
Progress and performance is monitored through the use of three national outcome frameworks: the NHS Outcomes Framework; the Public Health Outcomes Framework (PHOF); the Adult Social Care Outcomes Framework (ASCOF). As a means to support integration a number of the indicators within these are shared across two or more frameworks.
All frameworks include indicators that the home environment can have an impact on, but most of these are found within the PHOF.
There are a number of indicators within the framework that directly link to physical housing conditions and issues:
• Statutory homelessness – homelessness acceptances (Indicator 1.15i)
• Statutory homelessness – households in temporary accommodation (Indicator 1.15ii)
• Fuel poverty (Indicator 1.17)
• Injuries due to falls in people aged over 65 (by gender) (Indicator 2.24i-iii)
• Excess winter deaths index (by age and gender) (Indicator 4.15i-iv)
This Housing issues and health outcomes matrix presents these and other relevant indicators, alongside the housing issues where evidence suggests there is a relationship. It highlights those indicators which are shared with other frameworks. This matrix can be used as a ‘can opener’, to prompt a local discussion about whether poor quality and/or unsuitable housing could be contributory to poor performance in public health and other outcome indicators.
An introduction to the Public Health Outcomes Framework for non-health professionals
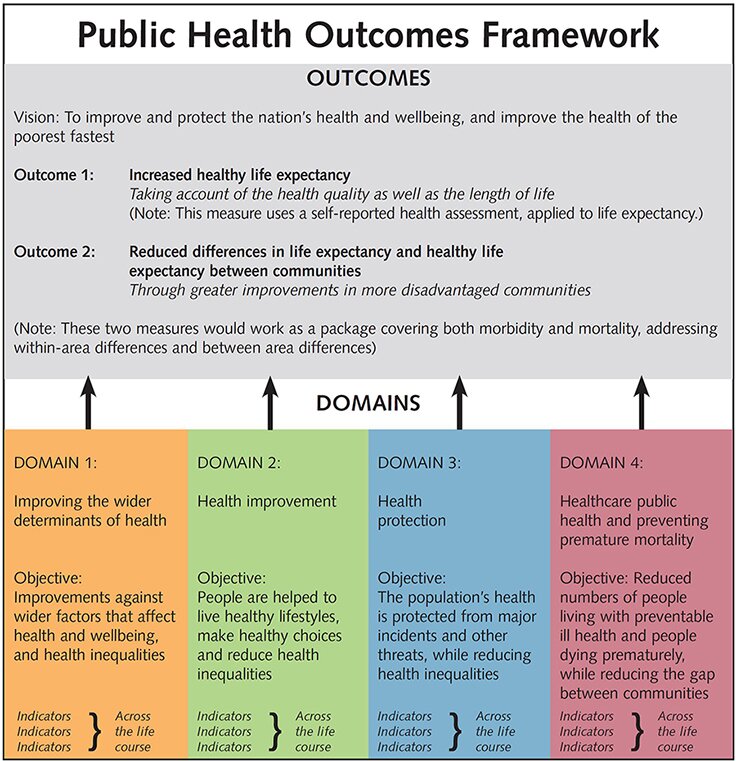
The PHOF has two headline outcomes: increasing healthy life expectancy, and reducing differences in life expectancy and health life expectancy between communities. There are four domains designed to measure a range of factors shaping health outcomes – and determining the presence (or otherwise) of health inequalities between different social groups and communities. A series of indicators underpin each domain:

|
Obtaining Public Health Outcomes Framework data for your local area
You can find out how well your local area is performing, and where action is needed, by accessing the latest data for the indicators contained within the Public Health Outcomes Framework.
This resource enables you to identify whether your relevant unitary authority or county council area is fairing ‘Better’, ‘Similar’ or ‘Worse’ in relation to the overarching indicators – and for the measures that feature within each of the four domains relating to underlying causes of poor health outcomes.
You can also use this interactive data resource to:
• compare indicators;
• map data;
• examine trends;
• compare areas;
• view area profiles;
• examine progress in tackling health inequalities.
If you want to keep updated about developments to the PHOF, you can do this by following the twitter account.
